How to read F1 telemetry: a step-by-step guide
Reading racing telemetry follows a clear sequence to understand where and why lap time is won or lost. My method begins with the Engineer report to identify which corners account for the largest time loss, zooms in on the racing line and speed profile, and finishes with driver inputs. You need to look at everything: steering angle, gears, and through certain sections even ERS. Data must always be cross-referenced: a driver can get on the throttle earlier and harder yet exit slower because of the wrong gear, or trigger snap oversteer for the exact same reason. In this guide, we analyse real sessions recorded in EA SPORTS F1 25 with the 2026 Season Pack to show how driving technique directly shapes lap times.
The seven-step reading order
When opening telemetry to compare two laps, examining every channel simultaneously creates confusion. I always follow seven structured steps:
- The track map: I look at the map immediately to identify the critical sections, and I begin from those.
- The Engineer report: consult the Engineer report to understand in which phase of the corner the delta develops.
- Targeting the key areas: at that point I know what to concentrate on, across the map and racing line as well as driver inputs (brake, throttle, steering, gears).
- The delta curve: the delta curve is not left to the end but examined almost straight away to pinpoint which phase to focus on. The delta trace and speed trace communicate similar information; each driver has their preference.
- Cross-chart cursor alignment: hovering the cursor over any point causes PitStatus to project dashed alignment lines across all charts simultaneously, revealing instantly where lap time slips away.
- Custom chart arrangement: charts can be dragged and reordered freely to suit your workflow, such as placing the delta trace at the top directly above driver inputs.
- Step-by-step interpretation: work through each sector asking «I am losing time here, why?». Interpret what the racing line and charts show: particularly brake, throttle, and gear selection, alongside steering angle.
Inside PitStatus, charts can be dragged and rearranged freely to suit your preference. At an advanced level, energy deployment tends to look similar between experienced drivers; meaningful differences almost always stem from brake and throttle execution.
Real case study at Zandvoort: 1:09.848 versus 1:10.037
 Engineer
Zandvoort · Qualifying
To see how telemetry works in practice, let us examine a real short qualifying session recorded at Zandvoort in my own car. We compare two laps: my personal best of 1:09.848 against a slower 1:10.037, separated by just under two tenths of a second.
In the faster lap the minimum speed is lower
Telemetry analysis frequently produces counterintuitive lessons for developing drivers. On the faster 1:09.848 lap, the minimum cornering speed, defined as the lowest speed reached at the apex before re-applying the throttle, is actually lower than on the slower lap. Many drivers assume carrying high speed into the apex guarantees a faster lap, but the opposite is often true: forcing entry speed delays rotation and compromises the exit onto the straight.
Turns 11 and 12: the decisive gain
The Engineer report reveals that while minor gaps exist across the lap, the primary gain occurs through the chicane at Turns 11 and 12.
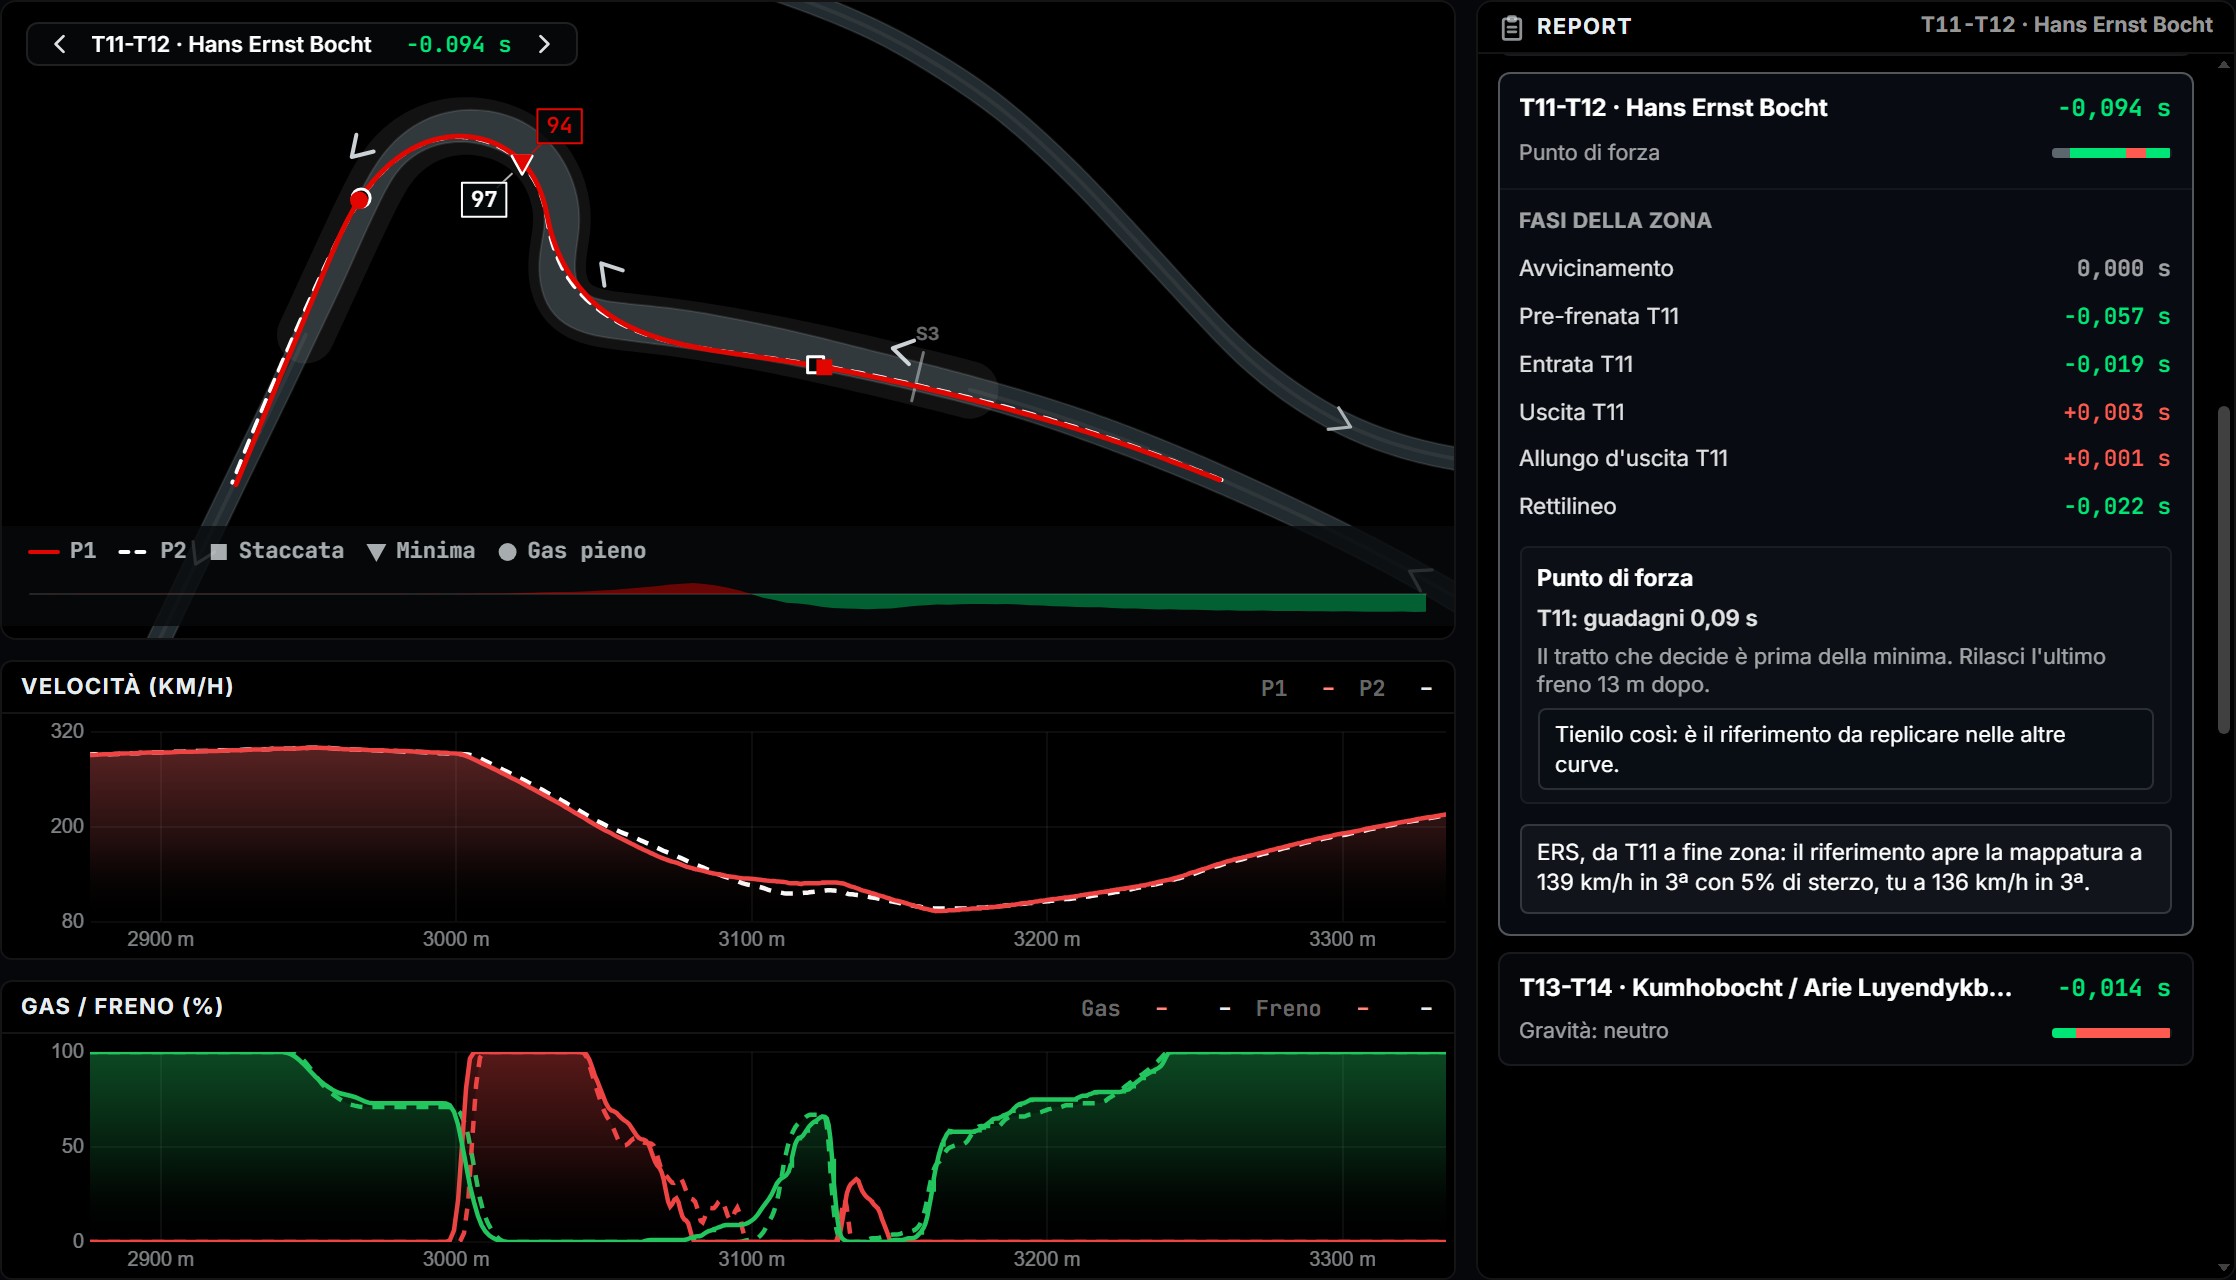
The Engineer indicates time gained in pre-braking, corner entry, and exit, whilst the initial straight-line acceleration remains neutral. Examining the speed, brake, and throttle traces uncovers the reason. Both laps approach the braking zone at identical speed, and braking for Turn 11 begins slightly earlier on the faster lap.
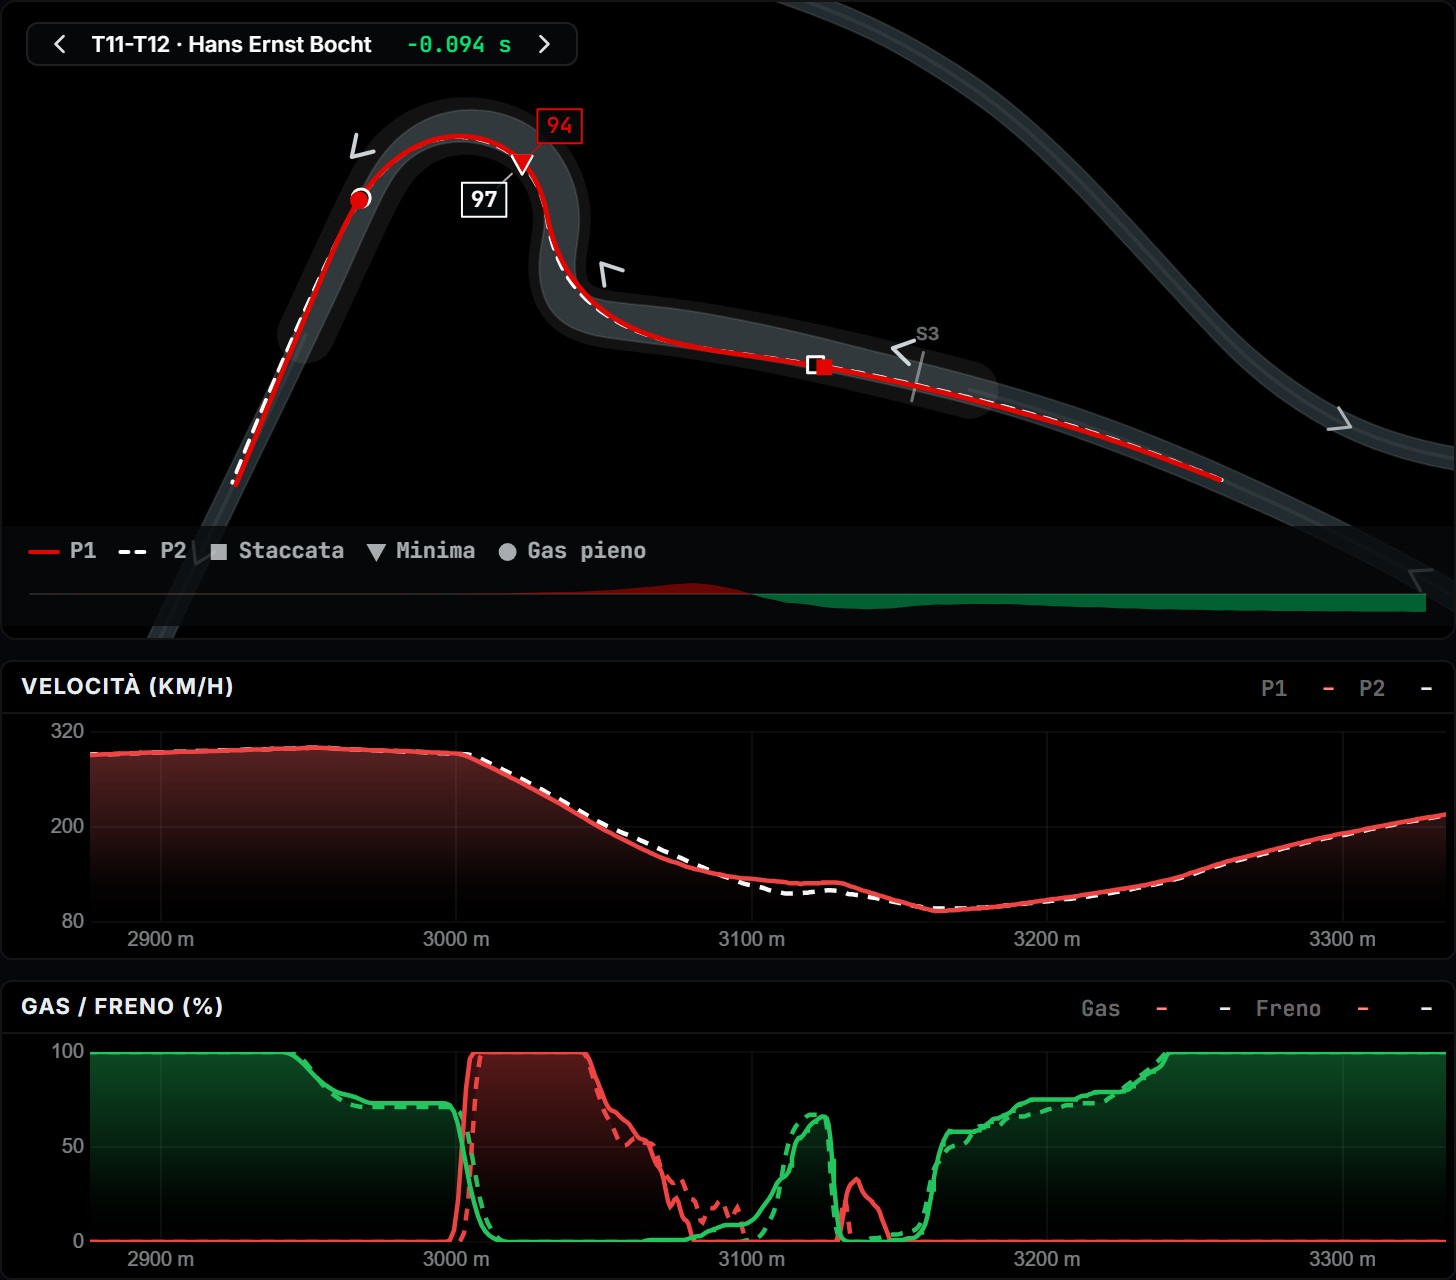
The critical difference lies in the brake release, or the gradual easing off the pedal whilst steering the car into the apex. On the faster lap, the release is noticeably quicker and sharper: the brake pedal remains applied for roughly 10 metres less distance. Speed stops decaying earlier, stabilising up to +10 km/h higher through the apex. Sacrificing a fraction of entry speed aided rotation, gaining time through mid-corner and matching exit speed: «lì ci esce il decimino».
Turn 1: releasing the brake earlier
Turn 1 displays the identical dynamic. Here too, minimum speed is lower and occurs slightly later in the corner. The initial braking marker matches, but the brake release is far more rapid and the pedal is held for less distance.
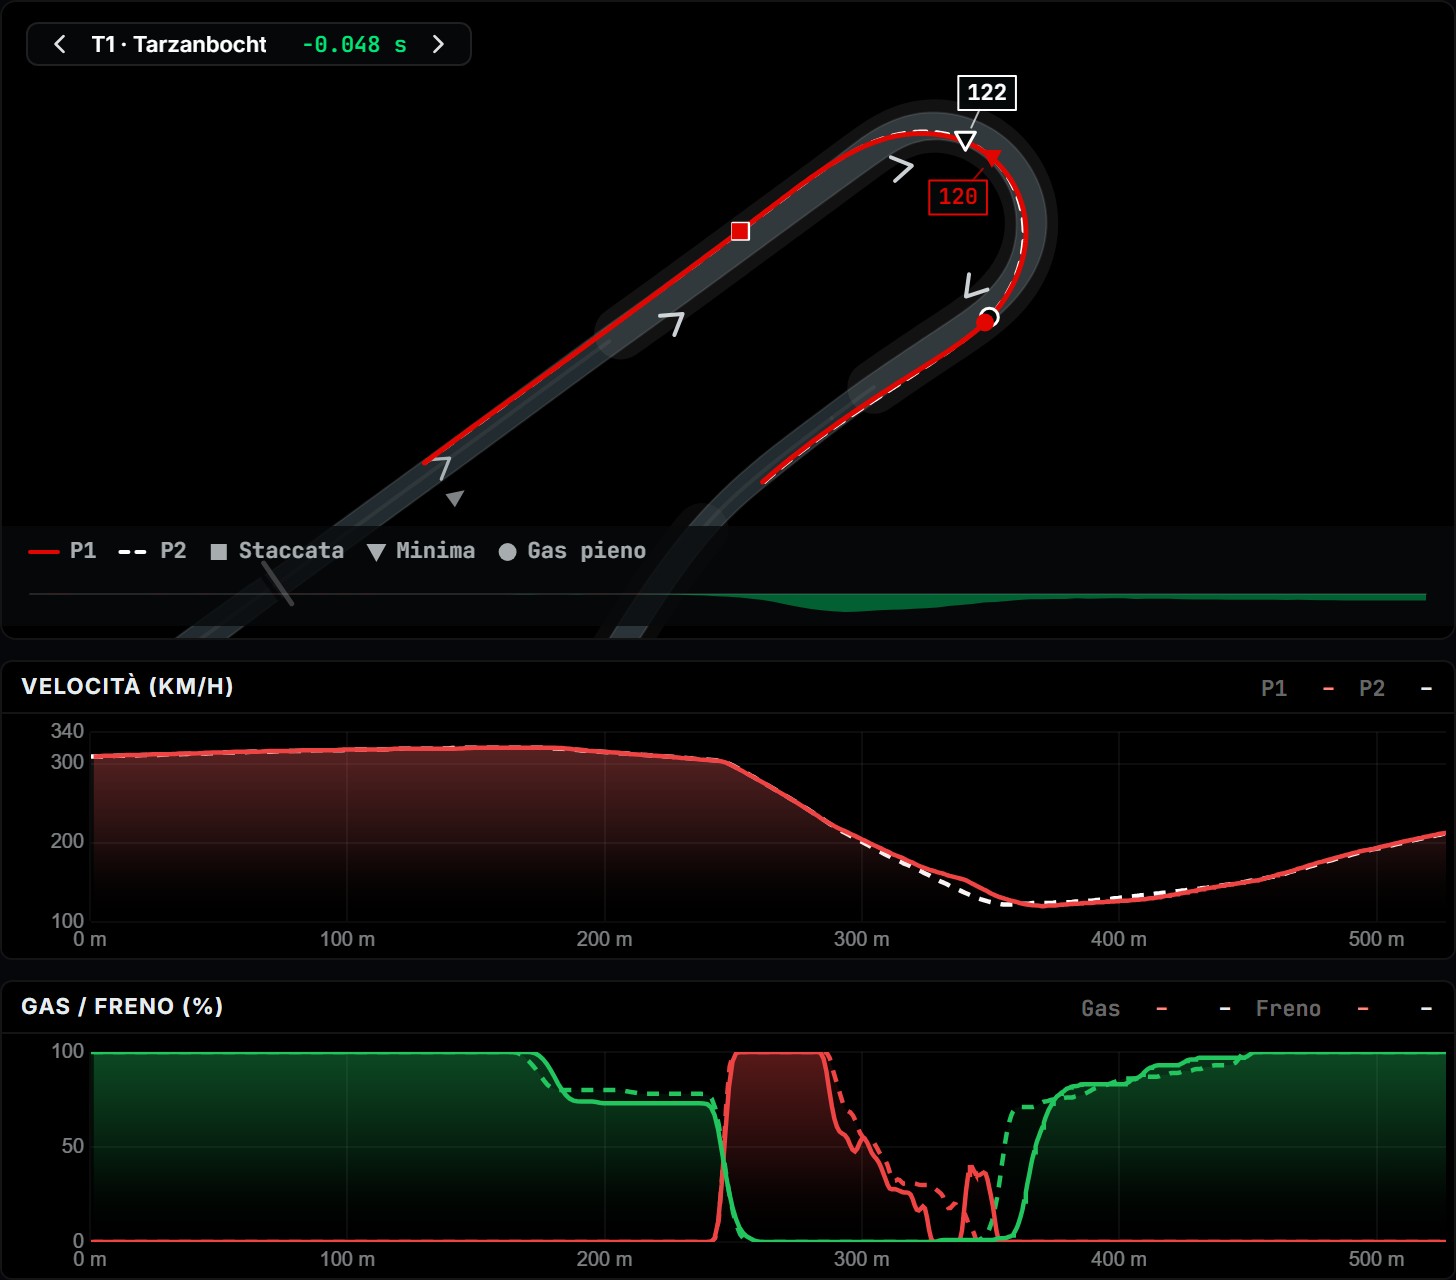
A cleaner line allowed the car to rotate without resistance, enabling a mid-corner advantage of +15 km/h that yielded approximately half a tenth. Across the remainder of the circuit, deltas between both laps are virtually neutral, demonstrating that ultimate pace hinges on coordinating steering, braking, and throttle inputs.
Comparison with the fastest driver in the session
To understand how benchmarking against rivals works, let us examine my best lap of 1:09.848 compared with the fastest driver in the session, who clocked a 1:09.508, a gap of 0.340 seconds. Out of respect for privacy, the rival driver remains unnamed and their telemetry charts are not published; the comparison is narrated purely through observed data.
The Engineer highlighted that the deficit was concentrated in three areas: Turns 2 to 5, Turns 7 to 9, and the final corner.
Through Turns 2 to 5, I lifted off the throttle roughly 40 metres earlier, applying lift and coast, the technique of lifting off the throttle before the braking zone to save energy and settle the car. The fastest driver in the session entered much harder, using a brief dab of the brakes rather than coasting, carrying +10 km/h and subsequently +30 km/h. My minimum speed was higher and initial traction was solid, but the other driver opened the throttle earlier and pulled away. Down the straight, I ceased deployment at 273 km/h whilst the rival reached 284 km/h. The diagnosis was clear: I was overly conservative on approach and exit.
Through Turns 7 to 9, I reduced throttle down to 17%, whereas the rival maintained 94%. A 4 km/h entry advantage transformed into a 12 km/h deficit. In the subsequent turn, I carried too much entry speed, ran wide, and had to correct, though exit was strong. The area for improvement was committing to the throttle in the opening phase.
At the final corner, both laps recorded identical minimum speed, but with contrasting lines. I braked at 55% pressure, whilst the fastest driver in the session applied barely 25%, braking later and lighter. Although I went to throttle earlier, I surrendered 6 to 7 km/h through entry and mid-corner, running out of battery before the line.
Regarding battery deployment, the fastest driver in the session used more energy heading towards Turn 6; I used slightly more between Turns 6 and 7, and I paid for that deficit approaching the start-finish straight. Over the entire lap, I actually consumed more electrical energy, starting with higher charge and finishing with less. «Sta nei dettagli: bisogna andare sulla zona zoomata.»
Braking: how to spot mistakes
Comparing traces against a reference lap makes braking errors instantly visible. However, braking errors must be contextualised: 100% brake pressure is only reached arriving at very high speed with heavy deceleration; across roughly half the braking zones on a circuit, you never hit 100% and need very progressive pedal application.
Examining the trace highlights the primary flaws:
- Braking too hard or dragging the brake too long: this year the major error is dragging the brake too deep or braking excessively, because engine braking sheds considerable speed; a sluggish release overloads the front axle and destroys minimum cornering speed.
- Abrupt release: modern cars require carrying a trailing touch of brake into the corner to keep load on the front axle; abruptly snapping from 30% to zero upsets chassis balance.
- Missing initial peak bite: failing to reach maximum pressure in the heaviest high-speed stops where 100% is necessary wastes metres before the car begins turning.
Throttle: wasted corner exits
A compromised corner exit shows up in the throttle pick-up point and progression. Two primary flaws occur repeatedly: picking up the throttle at too low a percentage, or advancing too hesitantly toward 100%.
Under current regulations, accelerating purely on combustion power delivers substantial mechanical grip. Throttle application must be interpreted alongside steering angle: if the steering wheel is already straight yet throttle percentage hesitates, the driver is leaving lap time on the table. Looking solely at minimum corner speed misses the bigger picture, because exit velocity determines speed down the entire following straight.
The most repeated advice
If I had to distill the advice I give most frequently to teammates after reviewing their telemetry into one sentence, it would be: «Vai prima sul gas, aggancia più forte e arriva prima al 100%.»
Many drivers carve tidy lines and brake well, but give away tenths on traction: they brake too early, drag the brakes too deep into the corner, and fail to let the car run freely. Telemetry proves that the largest gains come from releasing the car and committing decisively to the throttle.